Dark Energy is the dominant constituent of the universe, accounting for 2/3 of the mass-energy balance at present.
At least that is the canonical concordance cosmology, known as the ΛCDM or Lambda – Cold Dark Matter model. Here Λ is the symbol for the cosmological constant, the simplest, and apparently correct (according to most cosmologists), model for dark energy.
Models of galaxy formation and clustering use N-body simulations run on supercomputers to model the growth of structure (galaxy groups and clusters) in the universe. The cosmological parameters in these models are varied and then the models are compared to observed galaxy catalogs at various redshifts, representing different ages of the universe.
It all works pretty well except that the models assume a fully homogeneous universe on the large scale. While the universe is quite homogeneous for scales above a billion light-years, there is a great deal of filamentary web-like structure at scales above clusters, including superclusters and voids, as you can easily see in this map of our galactic neighborhood.
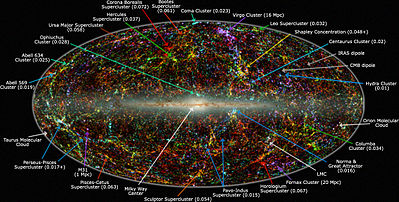
Galaxies and clusters in our neighborhood. – “Large Scale Structure in the Local Universe: The 2MASS Galaxy Catalog”, Jarrett, T.H. 2004, PASA, 21, 396
Well why not take that structure into account when doing the modeling? It has long been known that more local inhomogeneities such as those seen here might influence the observational parameters such as the Hubble expansion rate. Thus even at the same epoch, the Hubble parameter could vary from location to location.
Now a team from Hungary and Hawaii have modeled exactly that, in a paper entitled “Concordance cosmology without dark energy” https://arxiv.org/pdf/1607.08797.pdf . They simulate structure growth while estimating the local values of expansion parameter in many regions as their model evolves.
Starting with a completely matter dominated (Einstein – de Sitter) cosmology they find that they can reasonably reproduce the average expansion history of the universe — the scale factor and the Hubble parameter — and do that somewhat better than the Planck -derived canonical cosmology.
Furthermore, they claim that they can explain the tension between the Type Ia supernovae value of the Hubble parameter (around 73 kilometers per second per Megaparsec) and that determined from the Planck satellite observations of the cosmic microwave background radiation (67 km/s/Mpc).
Future surveys of higher resolution should be able to distinguish between their model and ΛCDM, and they also acknowledge that their model needs more work to fully confirm consistency with the cosmic microwave background observations.
Meanwhile I’m not ready to give up on dark energy and the cosmological constant since supernova observations, cosmic microwave background observations and the large scale galactic distribution (labeled BAO in the figure below) collectively give a consistent result of about 70% dark energy and 30% matter. But their work is important, something that has been a nagging issue for quite a while and one looks forward to further developments.
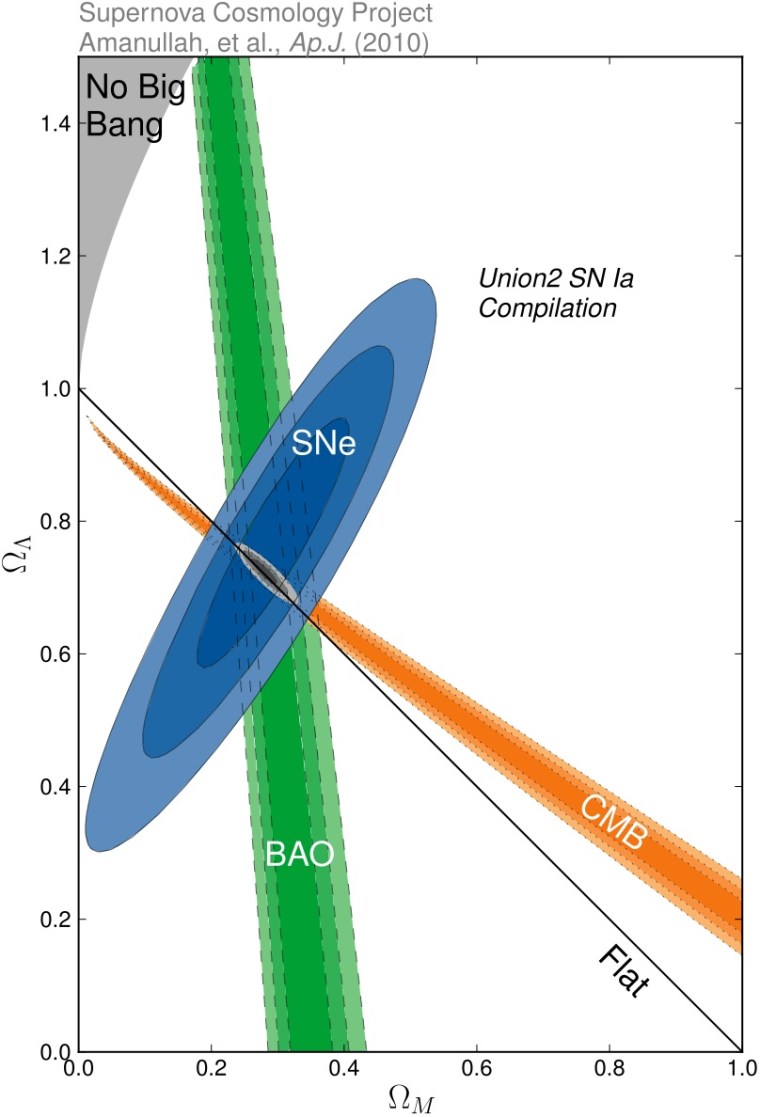
Dark Energy and Matter content of Universe


