Monthly Archives: April 2015

The Supervoid

The largest known structure in the universe goes by the name of the Supervoid. It is an enormously large under-dense region about 1.8 billion light-years in extent. Voids (actually low density regions) in galaxy and cluster density have been mapped over several decades.

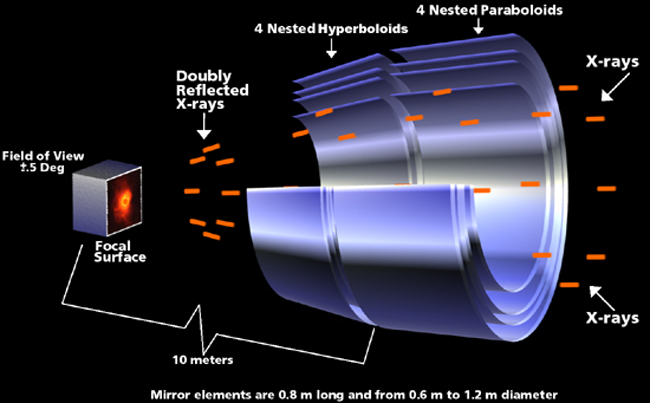
The cosmic microwave background radiation map from the Planck satellite and earlier experiments is extremely uniform. The temperature is about 2.7 Kelvins everywhere in the universe at present. There are small microKelvin scale fluctuations due to primordial density perturbations. The over-dense regions grow over cosmic timescales to become galaxies, groups and clusters of galaxies, and superclusters made of multiple clusters. Under-dense regions have fewer galaxies and groups per unit volume than the average.

The largest inhomogeneous region detected in the cosmic microwave background map is known as the Cold Spot and has a very slightly lower temperature by about 70 microKelvins (a microKelvin being only a millionth of a degree). It may be partly explained by a supervoid of radius 320 Megaparsecs, or around 1 billion light-years radius.

Superclusters heat cosmic microwave background photons slightly when they pass through, if there is significant dark energy in the universe. Supervoids cool the microwave background photons slightly. The reason is that, once dark energy becomes significant, during the second half of the universe’s expansion to date, it begins to smooth out superclusters and supervoids. It pushes the universe back towards greater uniformity while accelerating the overall expansion.

A photon will gain energy (blueshift) when it heads into a supercluster on its way to the Earth. This is an effect of general relativity. And as it leaves the other side of the supercluster as it continues its journey, it will lose energy (redshift) as it climbs out of the gravitational potential well. But while it is passing through the supercluster, that structure is spreading out due to the Big Bang overall expansion, and its gravitational potential is weakening. So the redshift or energy loss is smaller than the original energy gain or blueshift. So net-net, photons gain energy passing through a supercluster.

The opposite happens with a supervoid. Photons lose energy on the way in. They gain  energy on the way out, but less than they lost. Net-net photons lose energy, become colder, when passing through supervoids. Now all of this is relative to the overall redshift that all photons experience as they travel from the Big Bang last scattering surface to the Earth. During each period that the universe doubles in size, the Big Bang radiation doubles in wavelength, or halves in temperature.

In a newly published paper titled “Detection of a Supervoid aligned with the Cold Spot in the Cosmic Microwave Background”, astronomers looked at the distribution of galaxies in the direction of the well-established Cold Spot. The supervoid core redshift distance is in the range z = 0.15 to z = 0.25, corresponding to a distance of roughly 2 to 3 billion light-years from Earth.

They find a reduction in galaxy density of about 20%, and of dark matter around 14%, in the supervoid, relative to the overall average density values in the universe. The significance of the detection is high, around 5 standard deviations. The center of the low density region is well aligned with the position of the Cold Spot in the galactic Southern Hemisphere.

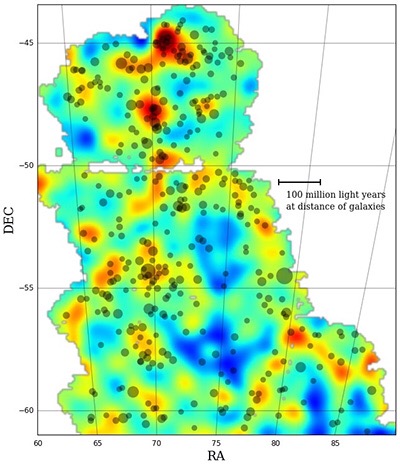
Both the existence of this supervoid and its alignment with the Cold Spot are highly significant. The chance of the two being closely aligned to this degree is calculated as just 1 chance in 20,000. The image below is Figure 2 from the authors’ paper and maps the density of galaxies in the left panel and the temperature differential of the microwave background radiation in the right panel. The white dot in the middle of each panel marks the center of the Cold Spot in the cosmic microwave background.

Supervoid.F2.large

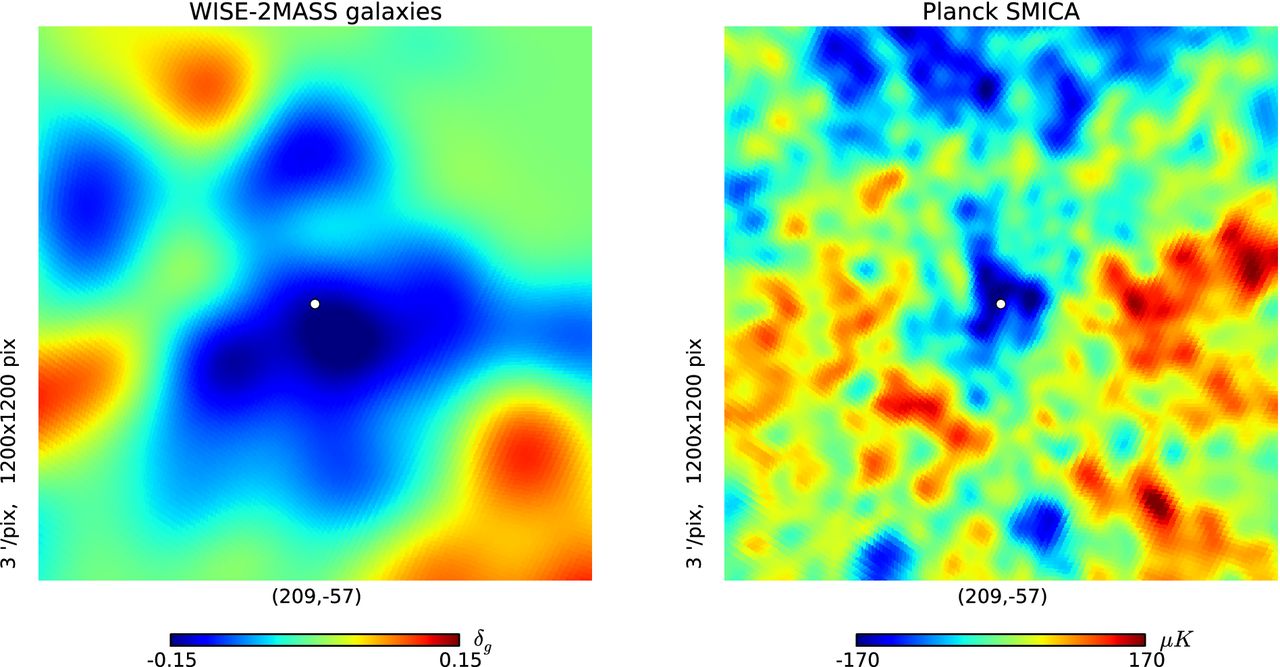
A lower density of galaxies is indicated by a blue color in the left panel. Red and orange colors denote a higher density of galaxies. The right panel shows slightly lower temperature of the cosmic microwave background in blue, and slightly higher temperature in red.

The authors have calculated the expected temperature reduction due to the supervoid; using a first-order model it is about 20 microKelvins. While this is not sufficient to explain the entire Cold Spot temperature decrease, it is a significant portion of the overall 70 microKelvin reduction.

Dark Energy is gradually smearing out the distinction between superclusters and supervoids. Dark Energy has come to dominate the universe’s mass-energy balance fairly recently, since about 5 billion years ago. If there is no change in the Dark Energy density, over many billions of years it will push all the galaxies so far apart from one another that no other galaxies will be detectable from our Milky Way.

References

I. Szapudi et al, 2015 M.N.R.A.S., Volume 450, Issue 1, p. 288, “Detection of a supervoid aligned with the cold spot of the cosmic microwave background” – http://mnras.oxfordjournals.org/content/450/1/288.full

S. Perrenod and M. Lesser, 1980, P.A.S.P. 91:764, “A Redshift Survey of a High-Multiplicity Supercluster” http://www.jstor.org/discover/10.2307/40677683?uid=2&uid=4&sid=21106121183081


Advertisement

X-raying Dark Matter

I was at the dentist this week. Don’t ask, but they took 3 digital X-Rays.

One of the most significant methods by which we detect the presence of dark matter is through the use of X-ray telescopes. The energy associated with these X-rays is typically around an order of magnitude less than those zapped into your mouth when you visit the dentist.

Around 50 years ago scientists at American Science and Engineering flew the first imaging X-ray telescope on a small rocket. At a later date, I worked part-time at AS&E, as we called it, while in graduate school. One major project was a solar X-Ray telescope mounted in SkyLab, America’s first space station. This gave me the wonderful opportunity to work in the control rooms at the NASA Johnson Space Center in Houston.

X-rays are absorbed in the Earth’s atmosphere, so today X-ray astronomy is performed from orbiting satellites. X-ray telescopes use the principle of grazing incidence reflection; the X-rays impinge at shallow angles onto gold or iridium-coated metallic surfaces and are reflected to the focal plane and the detector electronics.

cxcmirrors-72

Schematic of grazing incidence mirrors used in the Chandra X-ray Observatory. Credit NASA/CXC/SAO; obtained from chandra.harvard.edu.

How does dark matter result in X-rays being produced? Indirectly, as a consequence of its gravitational effects.

One of the main mechanisms for X-ray production in the universe is known as thermal bremsstrahlung. Bremsstrahlung is a German word meaning ‘decelerated radiation’. A gas which is hot enough to give off X-rays will be ionized. That is, the electrons will be stripped from the nuclei and move about freely. As electrons fly around near ions (protons and helium nuclei primarily) their mutual electromagnetic attraction will result in some of the electrons’ kinetic energy being transferred to radiation.

The speed at which the electrons are moving around determines how energetic the produced photons will be. We talk about the temperature of such an ionized gas, and that is proportional to the square of the average speed of the electrons. A gas with a temperature of 10 million degrees will give off approximately 1 kiloVolt X-rays (hereafter we use the KeV abbreviation), and a gas with a temperature of 100 million degrees will radiate 10 KeV X-rays. One eV converts to 11,605 degrees Kelvin (or we can just say Kelvins).

ChandrainColumbiabay

Chandra X-ray Observatory prior to launch in the Space Shuttle Columbia in 1999. NASA image.

So how can we produce gas hot enough to give off X-Rays by this mechanism? Gravity, and lots of it. The potential energy of the gravitational field is proportional to the amount of matter (total mass) coalesced into a region and inversely proportional to the characteristic scale of that region. GM/R, simple Newtonian mechanics, is sufficient; no general relativistic calculation is needed at this point. G is the gravitational constant and M and R are the cluster mass and characteristic radius, respectively.

A lot of mass in a confined region – how about large groups of clusters and galaxies? It turns out we need of order 1000 galaxies for a rich cluster and this will do the trick. But only because there is dark matter as well as ordinary matter. There are three main matter components to consider: galaxies, hot intracluster gas found between galaxies, and dark matter. The cluster forms from gravitational self-collapse from a region that was of above average density in the early universe. All the over dense regions are subject to collapse.

darkmatter.bulletcluster

The “Bullet Cluster” is actually two colliding clusters. The bluish color shows the distribution of dark matter as determined from the gravitational lensing effect on background galaxy images. The reddish color depicts the hot X-ray emitting gas measured by the Chandra X-ray Observatory.

(X-ray: NASA/CXC/CfA/M.Markevitch Optical: NASA/STScI; Magellan/U.Arizona/D.Clowe Lensing Map: NASA/STScI; ESO WFI; Magellan/U.Arizona/D.Clowe)

The optically visible galaxies are the least important contributor to the cluster mass, only around 1%! Galaxy clusters are made of dark matter much more than they are made out of galaxies. And secondarily, they are made out of hot gas. The ordinary matter contained within galaxies is only the third most important component. The table below gives the typical 90 / 9 / 1 proportions for dark matter, hot gas, and galaxies, respectively.

Three main components of a galaxy cluster (Table derived from Wikipedia article on galaxy clusters)

Component                      Mass fraction             Description

Galaxies                           1%                         Optical/infrared observations

Intergalactic gas              9%                         High temperature ionized gas – thermal bremsstrahlung

Dark matter                     90%                        Dominates, inferred through gravitational interactions

The intracluster gas has two sources. A major portion of it is primordial gas that never formed galaxies, but falls into the gravitational potential well of the cluster. As it falls in toward the cluster center, it heats. The kinetic energy of infall is converted to random motions of the ionized gas. An additional portion of the gas is recycled material expelled from galaxies. It mixes with the primordial gas and heats up as well through frictional processes. The gas is supported against further collapse by its own pressure as the density and temperature increase in the cluster core.

The temperature which characterizes the X-ray emission is a measure of gravitational potential strength and proportional to the ratio of the mass of the cluster to its size. Typical X-Ray temperatures measured for rich clusters are around 3 to 12 KeV, which corresponds to temperatures in the range of 30 to 130 million Kelvins.

There is another way to measure the strength of the cluster’s gravitational potential well. That is by measuring the speed of galaxies as they move around in somewhat random fashion inside the cluster. The assumption, which is valid for well-formed clusters after they have been around for billions of years, is that the galaxies are not just falling into the center of the cluster, but that their motions are “virialized”. This is the method used by Fritz Zwicky in the 1930s for the original discovery of dark matter. He found that in a certain well known cluster, the Coma cluster, that the average speed of galaxies relative to the cluster centroid was of order 1000 kilometers/sec, much higher than the expected 300 km/sec based on the visible light from the cluster galaxies. This implied 10 times as much dark matter as galactic matter. This early, rather crude measurement, was on the right track, but fell short of the actual ratio of dark matter to galactic matter since we now know that galaxies themselves have large dark matter halos. The X-ray emission from clusters was discovered much later, starting in the 1970s.

The two methods of measuring the amount of dark matter in Galaxy clusters generally agree. Both the galaxies and the hot intracluster gas are acting as tracers of the overall mass distribution, which is dominated by dark matter. Galaxy clusters play a major role in increasing our understanding of dark matter and how it affects the formation and evolution of galaxies.

In fact if dark matter was not 5 times as abundant by mass as ordinary matter, most galaxy clusters would never have formed, and galaxies such as our own Milk Way would be much smaller.

References

Wikipedia article “galaxy clusters”.

“X-ray Temperatures of Distant Clusters of Galaxies”, S. C. Perrenod,  J. P. Henry 1981, Astrophysical Journal, Letters to the Editor, vol. 247, p. L1-L4.

“The X-ray Luminosity – Velocity Dispersion Relation in the REFLEX Cluster Survey”, A. Ortiz-Gil, L. Guzzo, P. Schuecker, H. Boehringer, C.A. Collins 2004, Mon.Not.Roy.Astron.Soc. 348, 325; http://arxiv.org/abs/astro-ph/0311120v1


Multi-Billion Light-Year Map: Dark Energy Survey first results

Perhaps the most amazing map ever created by mankind has just been published by astronomers from the Dark Energy Survey collaboration. It’s either this map below or the latest Cosmic Microwave Background map from the Planck satellite. Personally, I find this new map of our “neighborhood” more exciting and esthetic, as it shows the explicit locations of several hundred clusters of galaxies together with the distribution of dark matter across a very large scale.

The Dark Energy Camera (DECam) is a 570 Megapixel system designed by the DES collaboration for deep galaxy survey work. It sits at the focal plane of the 4 meter Victor M. Blanco telescope at the National Optical Astronomy Observatory’s Cerro Tololo Inter-American Observatory in Chile. The Dark Energy Survey team will acquire data over a 5-year period. This is the first map released, based on a small percentage of the data that will ultimately be collected.

Over 2 million galaxies were observed with DECam to create this map, and a supercomputer was required to analyze the data and compare it to theoretical expectations for dark matter and galaxy distributions. The map shows the distribution of dark matter, clusters of galaxies, and matter filaments and voids in a field of 139 square degrees. That’s roughly 1/2 billion light-years or so in the horizontal direction and in the vertical direction. 

The redshifts, and thus distances, of the galaxies in the survey sample have been determined photometrically, by comparing the luminosity of a given galaxy in various wave bands in the optical and infrared regions of the spectrum. About 1 million of the galaxies in the survey are background galaxies with redshifts above 0.6, and another million plus are foreground galaxies with redshifts below 0.5. The higher the redshift, the more distant the galaxy, since the universe is expanding in a uniform fashion. The redshift measures the shift of light toward the red end of the spectrum as it is “stretched out” along with this expansion.

The light from background galaxies is distorted as it passes through concentrations of dark matter on its way to the Earth and the DECam. This is due to gravitational lensing, a consequence of Einstein’s general relativity. A background galaxy’s image will shear in proportion to the strength of the gravitational field its light encounters during its journey to the Earth. 

The amount of shear seen by each of the million or so background galaxies is used to infer the map of the distribution of dark matter at redshift 0.5 and below. This corresponds to a lookback time of up to 5 billion years. Coincidentally, the redshift of 0.5 is around the time when dark energy began to be more important than dark matter, and the expansion of the universe began to accelerate, rather than decelerate. 

The dots on the map are not individual galaxies; rather they are rich clusters of galaxies. Each  cluster is a gravitationally bound system, dominated by dark matter, and containing 100s to 1000s of galaxies. Typically the galaxies themselves contribute only about 1% of a cluster’s mass, and the dark matter can contribute up to 90% of the total. The remainder is found as hot X-ray emitting gas residing between galaxies, but still bound to the cluster due to the predominant gravitational potential contribution from the dark matter.

DES map of dark matter density

The red areas on the map represent the highest concentrations of dark matter, the orange and yellow areas the next highest, and the blue areas the lowest. These blue areas are called voids because of their low density of dark matter and clusters of galaxies. One clearly sees the existence of dark matter filamentary structures in the red, orange, yellow colors. 

Clusters of galaxies are represented by the gray dots, and the larger the dot, the “richer” or larger the cluster. It’s evident to the eye that the clusters are preferentially found in the same locations as the reddish areas and yellow filaments. They are scarcely to be found in the blue-colored voids. The point is that the ordinary matter, which is most concentrated in galaxy clusters, follows the dark matter density, as expected. 

Peruse the map, and let your mind wander out into the vast reaches of intergalactic space.

This is just the beginning; this map was created from the very preliminary observations made in the DES. The survey team plans to eventually acquire 35 times as much coverage of the sky as this map provides. The full survey is expected to advance our knowledge of the nature and distribution of both dark matter and dark energy substantially.

The press release of April 13th announcing this truly amazing map can be found here: http://www.fnal.gov/pub/presspass/press_releases/2015/Mapping-The-Cosmos-20150413.html

“The Dark Energy Survey is a collaboration of more than 300 scientists from 25 institutions in six countries. Its primary instrument, the Dark Energy Camera, is mounted on the 4-meter Blanco telescope at the National Optical Astronomy Observatory’s Cerro Tololo Inter-American Observatory in Chile, and its data is processed at the National Center for Supercomputing Applications at the University of Illinois at Urbana-Champaign.”


Planck 2015 Constraints on Dark Energy and Inflation

The European Space Agency’s Planck satellite gathered data for over 4 years, and a series of 28 papers releasing the results and evaluating constraints on cosmological models have been recently released. In general, the Planck mission’s complete results confirm the canonical cosmological model, known as Lambda Cold Dark Matter, or ΛCDM. In approximate percentage terms the Planck 2015 results indicate 69% dark energy, 26% dark matter, and 5% ordinary matter as the mass-energy components of the universe (see this earlier blog:

https://darkmatterdarkenergy.com/2015/03/07/planck-mission-full-results-confirm-canonical-cosmology-model/)

Dark Energy

We know that dark energy is the dominant force in the universe, comprising 69% of the total energy content. And it exerts a negative pressure causing the expansion to continuously speed up. The universe is not only expanding, but the expansion is even accelerating! What dark energy is we do not know, but the simplest explanation is that it is the energy of empty space, of the vacuum. Significant departures from this simple model are not supported by observations.

The dark energy equation of state is the relation between the pressure exerted by dark energy and its energy density. Planck satellite measurements are able to constrain the dark energy equation of state significantly. Consistent with earlier measurements of this parameter, which is usually denoted as w, the Planck Consortium has determined that w = -1 to within 4 or 5 percent (95% confidence).

According to the Planck Consortium, “By combining the Planck TT+lowP+lensing data with other astrophysical data, including the JLA supernovae, the equation of state for dark energy is constrained to w = −1.006 ± 0.045 and is therefore compatible with a cosmological constant, assumed in the base ΛCDM cosmology.”

A value of -1 for w corresponds to a simple Cosmological constant model with a single parameter Λ  that is the present-day energy density of empty space, the vacuum. The Λ value measured to be 0.69 is normalized to the critical mass-energy density. Since the vacuum is permeated by various fields, its energy density is non-zero. (The critical mass-energy density is that which results in a topologically flat space-time for the universe; it is the equivalent of 5.2 proton masses per cubic meter.)

Such a model has a negative pressure, which leads to the accelerated expansion that has been observed for the universe; this acceleration was first discovered in 1998 by two teams using certain supernova as standard candle distance indicators, and measuring their luminosity as a function of redshift distance.

Modified gravity

The phrase modified gravity refers to models that depart from general relativity. To date, general relativity has passed every test thrown at it, on scales from the Earth to the universe as a whole. The Planck Consortium has also explored a number of modified gravity models with extensions to general relativity. They are able to tighten the restrictions on such models, and find that overall there is no need for modifications to general relativity to explain the data from the Planck satellite.

Primordial density fluctuations

The Planck data are consistent with a model of primordial density fluctuations that is close to, but not precisely, scale invariant. These are the fluctuations which gave rise to overdensities in dark matter and ordinary matter that eventually collapsed to form galaxies and the observed large scale structure of the universe.

The concept is that the spectrum of density fluctuations is a simple power law of the form

P(k) ∝ k**(ns−1),

where k is the wave number (the inverse of the wavelength scale). The Planck observations are well fit by such a power law assumption. The measured spectral index of the perturbations has a slight tilt away from 1, with the existence of the tilt being valid to more than 5 standard deviations of accuracy.

ns = 0.9677 ± 0.0060

The existence and amount of this tilt in the spectral index has implications for inflationary models.

Inflation

The Planck Consortium authors have evaluated a wide range of potential inflationary models against the data products, including the following categories:

  • Power law
  • Hilltop
  • Natural
  • D-brane
  • Exponential
  • Spontaneously broken supersymmetry
  • Alpha attractors
  • Non-minimally coupled

Figure 12 from Constraints on InflationFigure 12 from Planck 2015 results XX Constraints on Inflation. The Planck 2015 data constraints are shown with the red and blue contours. Steeper models with  V ~ φ³ or V ~ φ² appear ruled out, whereas R² inflation looks quite attractive.

Their results appear to rule out some of these, although many models remain consistent with the data. Power law models with indices greater or equal to 2 appear to be ruled out. Simple slow roll models such as R² inflation, which is actually the first inflationary model proposed 35 years ago, appears more favored than others. Brane inflation and exponential inflation are also good fits to the data. Again, many other models still remain statistically consistent with the data.

Simple models with a few parameters characterizing the inflation suffice:

“Firstly, under the assumption that the inflaton* potential is smooth over the observable range, we showed that the simplest parametric forms (involving only three free parameters including the amplitude V (φ∗ ), no deviation from slow roll, and nearly power-law primordial spectra) are sufficient to explain the data. No high-order derivatives or deviations from slow roll are required.”

* The inflaton is the name cosmologists give to the inflation field

“Among the models considered using this approach, the R2 inflationary model proposed by Starobinsky (1980) is the most preferred. Due to its high tensor- to-scalar ratio, the quadratic model is now strongly disfavoured with respect to R² inflation for Planck TT+lowP in combination with BAO data. By combining with the BKP likelihood, this trend is confirmed, and natural inflation is also disfavoured.”

Isocurvature and tensor components

They also evaluate whether the cosmological perturbations are purely adiabatic, or include an additional isocurvature component as well. They find that an isocurvature component would be small, less than 2% of the overall perturbation strength. A single scalar inflaton field with adiabatic perturbations is sufficient to explain the Planck data.

They find that the tensor-to-scalar ratio is less than 9%, which again rules out or constrains certain models of inflation.

Summary

The simplest LambdaCDM model continues to be quite robust, with the dark energy taking the form of a simple cosmological constant. It’s interesting that one of the oldest and simplest models for inflation, characterized by a power law relating the potential to the inflaton amplitude, and dating from 35 years ago, is favored by the latest Planck results. A value for the power law index of less than 2 is favored. All things being equal, Occam’s razor should lead us to prefer this sort of simple model for the universe’s early history. Models with slow-roll evolution throughout the inflationary epoch appear to be sufficient.

The universe started simply, but has become highly structured and complex through various evolutionary processes.

References

Planck Consortium 2015 papers are at http://www.cosmos.esa.int/web/planck/publications – This site links to the 28 papers for the 2015 results, as well as earlier publications. Especially relevant are these – XIII Cosmological parameters, XIV Dark energy and modified gravity, and XX Constraints on inflation.