Tag Archives: Planck satellite

Dark Energy Survey First Results: Canonical Cosmology Supported

The Dark Energy Survey (DES) first year results, and a series of papers, were released on August 4, 2017. This is a massive international collaboration with over 60 institutions represented and 200 authors on the paper summarizing initial results. Over 5 years the Dark Energy Survey team plans to survey some 300 million galaxies.

The instrument is the 570-megapixel Dark Energy Camera installed on the Cerro Tololo Inter-American Observatory 4-meter Blanco Telescope.

11-0222-13D_hr2-682x1024.jpg

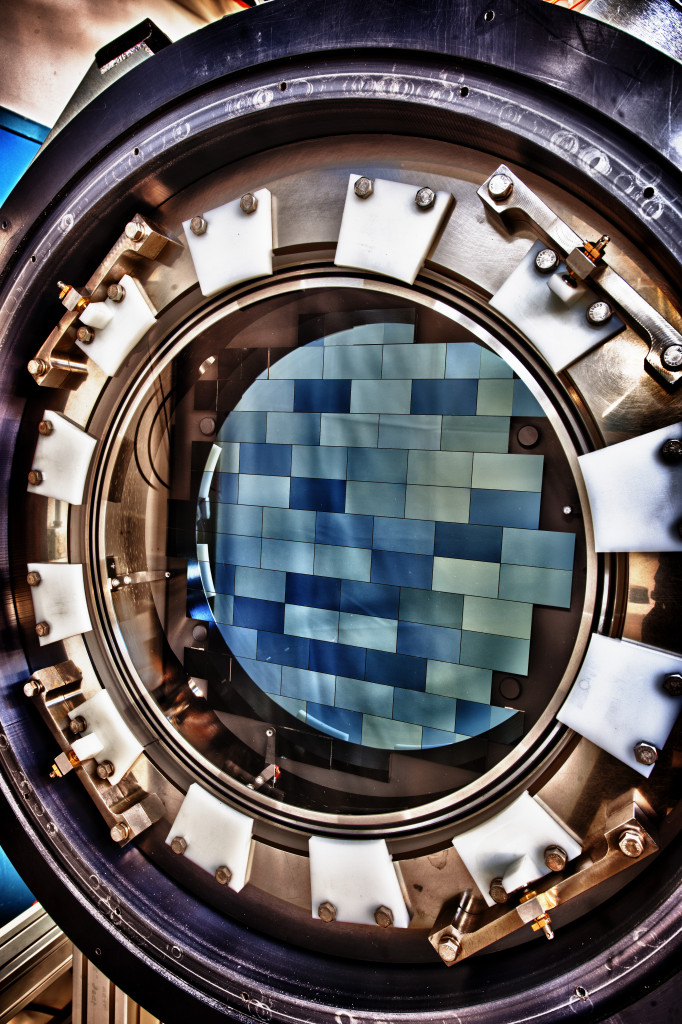
Image: DECam imager with CCDs (blue) in place. Credit: darkenergysurvey.org

Over 26 million source galaxy measurements from far, far away are included in these initial results. Typical distances are several billion light-years, up to 9 billion light-years. Also included is a sample of 650,000 luminous red galaxies, lenses for the gravitational lensing, and typically these are foreground elliptical galaxies. These are at redshifts < 0.9 corresponding to up to 7 billion light-years.

They use 3 main methods to make cosmological measurements with the sample:

1. The correlations of galaxy positions (galaxy-galaxy clustering)

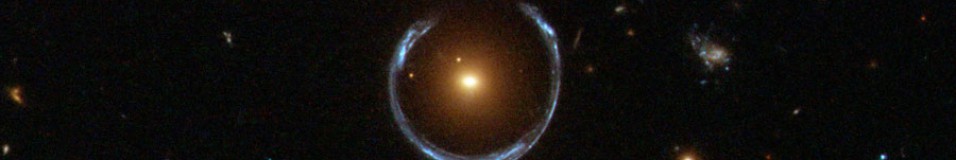
2. The gravitational lensing of the large sample of background galaxies by the smaller foreground population (cosmic shear)

3. The gravitational lensing of the luminous red galaxies (galaxy-galaxy lensing)

Combining these three methods provides greater interpretive power, and is very effective in eliminating nuisance parameters and systematic errors. The signals being teased out from the large samples are at only the one to ten parts in a thousand level.

They determine 7 cosmological parameters including the overall mass density (including dark matter), the baryon mass density, the neutrino mass density, the Hubble constant, and the equation of state parameter for dark energy. They also determine the spectral index and characteristic amplitude of density fluctuations.

Their results indicate Ωm of 0.28 to a few percent, indicating that the universe is 28% dark matter and 72% dark energy. They find a dark energy equation of state w = – 0.80 but with error bars such that the result is consistent with either a cosmological constant interpretation of w = -1 or a somewhat softer equation of state.

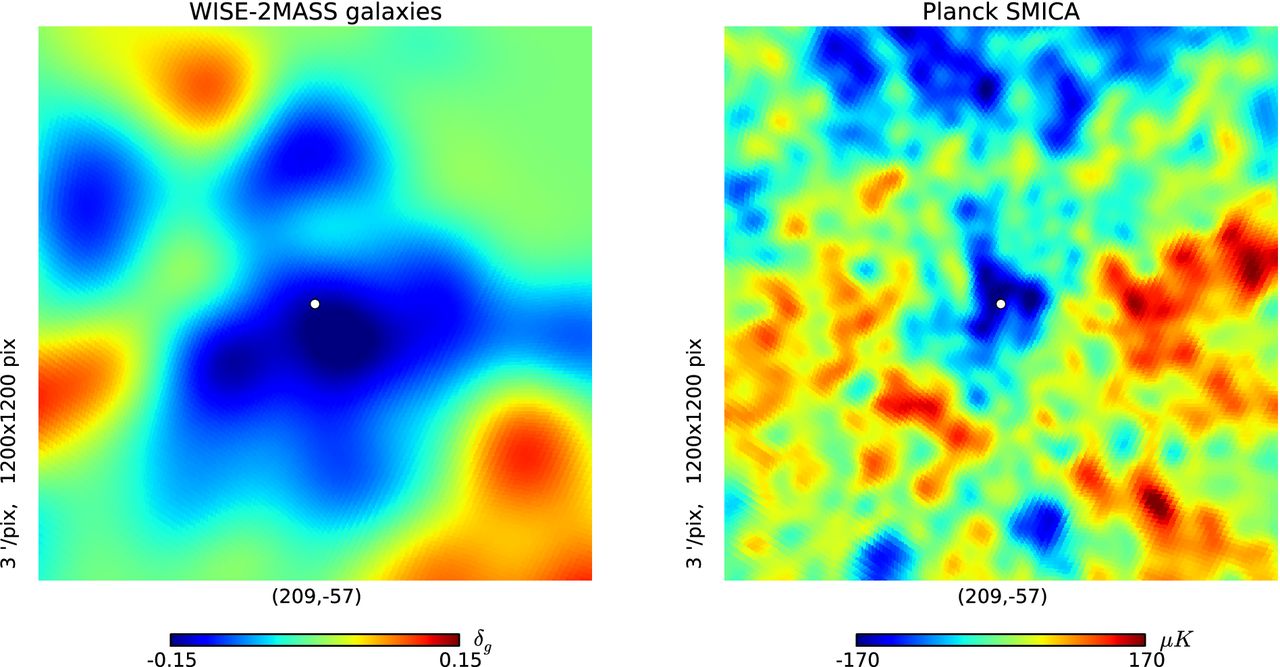
They compare the DES results with those from the Planck satellite for the cosmic microwave background and find they are statistically significant with each other and with the Λ-Cold Dark MatterΛ model (Λ, or Lambda, stands for the cosmological constant). They also compare to other galaxy correlation measurements known as BAO for Baryon Acoustic Oscillations (very large scale galaxy structure reflecting the characteristic scale of sound waves in the pre-cosmic microwave background plasma) and to Type 1a supernovae data.

This broad agreement with Planck results is a significant finding since the cosmic microwave background is at very early times, redshift z = 1100 and their galaxy sample is at more recent times, after the first five billion years had elapsed, with z < 1.4 and more typically when the universe was roughly ten billion years old.

Upon combining with Planck, BAO, and the supernovae data the best fit is Ωm of 0.30 with an error of less than 0.01, the most precise determination to date. Of this, about 0.25 is ascribed to dark matter and 0.05 to ordinary matter (baryons). And the implied dark energy fraction is 0.70.

Furthermore, the combined result for the equation of state parameter is precisely w = -1.00 with only one percent uncertainty.

The figure below is Figure 9 from the DES paper. The figure indicates, in the leftmost column the measures and error bars for the amplitude of primordial density fluctuations, in the center column the fraction of mass-energy density in matter, and in the right column the equation of state parameter w.

DES.aug17.paper1.fig9.jpeg

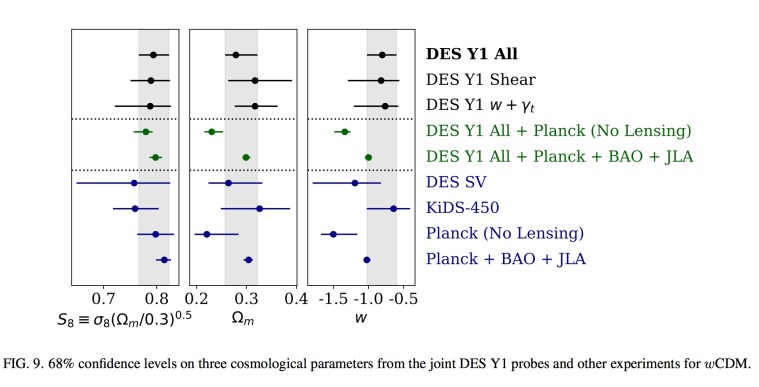
The DES year one results for all 3 methods are shown in the first row. The Planck plus BAO plus supernovae combined results are shown in the last row. And the middle row, the fifth row, shows all of the experiments combined, statistically. Note the values of 0.3 and – 1.0 for Ωm and w, respectively, and the extremely small error bars associated with these.

This represents continued strong support for the canonical Λ-Cold Dark Matter cosmology, with unvarying dark energy described by a cosmological constant.

They did not evaluate modifications to general relativity such as Emergent Gravity or MOND with respect to their data, but suggest they will evaluate such a possibility in the future.

References

https://arxiv.org/abs/1708.01530, “Dark Energy Survey Year 1 Results: Cosmological Constraints from Galaxy Clustering and Weak Lensing”, 2017, T. Abbott et al.

https://en.wikipedia.org/wiki/Weak_gravitational_lensing, Wikipedia article on weak gravitational lensing discusses galaxy-galaxy lensing and cosmic shear


The Supervoid

The largest known structure in the universe goes by the name of the Supervoid. It is an enormously large under-dense region about 1.8 billion light-years in extent. Voids (actually low density regions) in galaxy and cluster density have been mapped over several decades.

The cosmic microwave background radiation map from the Planck satellite and earlier experiments is extremely uniform. The temperature is about 2.7 Kelvins everywhere in the universe at present. There are small microKelvin scale fluctuations due to primordial density perturbations. The over-dense regions grow over cosmic timescales to become galaxies, groups and clusters of galaxies, and superclusters made of multiple clusters. Under-dense regions have fewer galaxies and groups per unit volume than the average.

The largest inhomogeneous region detected in the cosmic microwave background map is known as the Cold Spot and has a very slightly lower temperature by about 70 microKelvins (a microKelvin being only a millionth of a degree). It may be partly explained by a supervoid of radius 320 Megaparsecs, or around 1 billion light-years radius.

Superclusters heat cosmic microwave background photons slightly when they pass through, if there is significant dark energy in the universe. Supervoids cool the microwave background photons slightly. The reason is that, once dark energy becomes significant, during the second half of the universe’s expansion to date, it begins to smooth out superclusters and supervoids. It pushes the universe back towards greater uniformity while accelerating the overall expansion.

A photon will gain energy (blueshift) when it heads into a supercluster on its way to the Earth. This is an effect of general relativity. And as it leaves the other side of the supercluster as it continues its journey, it will lose energy (redshift) as it climbs out of the gravitational potential well. But while it is passing through the supercluster, that structure is spreading out due to the Big Bang overall expansion, and its gravitational potential is weakening. So the redshift or energy loss is smaller than the original energy gain or blueshift. So net-net, photons gain energy passing through a supercluster.

The opposite happens with a supervoid. Photons lose energy on the way in. They gain  energy on the way out, but less than they lost. Net-net photons lose energy, become colder, when passing through supervoids. Now all of this is relative to the overall redshift that all photons experience as they travel from the Big Bang last scattering surface to the Earth. During each period that the universe doubles in size, the Big Bang radiation doubles in wavelength, or halves in temperature.

In a newly published paper titled “Detection of a Supervoid aligned with the Cold Spot in the Cosmic Microwave Background”, astronomers looked at the distribution of galaxies in the direction of the well-established Cold Spot. The supervoid core redshift distance is in the range z = 0.15 to z = 0.25, corresponding to a distance of roughly 2 to 3 billion light-years from Earth.

They find a reduction in galaxy density of about 20%, and of dark matter around 14%, in the supervoid, relative to the overall average density values in the universe. The significance of the detection is high, around 5 standard deviations. The center of the low density region is well aligned with the position of the Cold Spot in the galactic Southern Hemisphere.

Both the existence of this supervoid and its alignment with the Cold Spot are highly significant. The chance of the two being closely aligned to this degree is calculated as just 1 chance in 20,000. The image below is Figure 2 from the authors’ paper and maps the density of galaxies in the left panel and the temperature differential of the microwave background radiation in the right panel. The white dot in the middle of each panel marks the center of the Cold Spot in the cosmic microwave background.

Supervoid.F2.large

A lower density of galaxies is indicated by a blue color in the left panel. Red and orange colors denote a higher density of galaxies. The right panel shows slightly lower temperature of the cosmic microwave background in blue, and slightly higher temperature in red.

The authors have calculated the expected temperature reduction due to the supervoid; using a first-order model it is about 20 microKelvins. While this is not sufficient to explain the entire Cold Spot temperature decrease, it is a significant portion of the overall 70 microKelvin reduction.

Dark Energy is gradually smearing out the distinction between superclusters and supervoids. Dark Energy has come to dominate the universe’s mass-energy balance fairly recently, since about 5 billion years ago. If there is no change in the Dark Energy density, over many billions of years it will push all the galaxies so far apart from one another that no other galaxies will be detectable from our Milky Way.

References

I. Szapudi et al, 2015 M.N.R.A.S., Volume 450, Issue 1, p. 288, “Detection of a supervoid aligned with the cold spot of the cosmic microwave background” – http://mnras.oxfordjournals.org/content/450/1/288.full

S. Perrenod and M. Lesser, 1980, P.A.S.P. 91:764, “A Redshift Survey of a High-Multiplicity Supercluster” http://www.jstor.org/discover/10.2307/40677683?uid=2&uid=4&sid=21106121183081